How can a1U server display vital stats with an ultra-thin bar LCD?
 2026-05-17
  16:52
16:52 

1U server monitoring with ultra-thin bar LCDs provides a critical, space-efficient solution for real-time hardware status display in dense data center racks, enabling administrators to instantly view vital system stats like temperature, load, and network activity without needing a KVM switch or remote login, thus enhancing operational efficiency and reducing downtime.
What are the core technical specifications of a1U rackmount LCD?
Understanding the technical specifications of a1U rackmount LCD is essential for integration and performance. Key parameters include the physical dimensions, display technology, resolution, connectivity interfaces, and power requirements. These specs determine compatibility with server hardware and the clarity of the information presented to the user in a constrained space.
The core specifications of a1U rackmount LCD revolve around its compact form factor and functional clarity. Physically, it must fit within the standard1.75-inch (44.45mm) height of a1U server rack slot, with a typical width of19 inches for rack compatibility. The display itself is often a TFT LCD, chosen for its reliability and viewing angle. Resolution is a critical factor; a bar-type display might offer a resolution of480x64 or800x128 pixels, which is sufficient for scrolling text and basic graphical representations of data. Connectivity is paramount, with interfaces like USB for data transfer and power, or RS-232 for legacy systems, alongside HDMI or DVI for potential video passthrough. Power consumption is typically low, often drawing directly from the server’s USB port. For example, integrating such a display is akin to adding a dedicated car dashboard for your server, giving you at-a-glance diagnostics without popping the hood. How do you ensure the data feed is both accurate and low-latency? What protocols are best for pulling system statistics without adding significant CPU overhead? Consequently, selecting a unit with the right interface and software support is as important as the hardware specs. Manufacturers like CDTech often provide SDKs or APIs that allow for custom data field configuration, turning raw specs into actionable intelligence.
How does an ultra-thin bar LCD enhance data center monitoring?
An ultra-thin bar LCD enhances data center monitoring by providing immediate, at-a-glance visibility into server health from the rack itself. It eliminates the delay of remote access tools, allowing for rapid physical inspection and troubleshooting. This direct visual feedback loop is crucial for identifying hardware failures, thermal issues, or network outages the moment they occur on the data center floor.
The enhancement provided by an ultra-thin bar LCD stems from its role as a persistent physical interface in an increasingly virtualized management environment. In a dense server rack, identifying a specific problematic unit can be like finding a needle in a haystack, especially if all bezels look identical. A bar LCD, mounted on the server’s front panel, acts as a nametag and health monitor combined. It can display custom identifiers, IP addresses, real-time CPU and memory utilization, drive health status from RAID controllers, network throughput, and inlet/exit temperatures. This transforms a walk-through inspection from a guessing game into a targeted diagnostic session. Imagine a hospital ICU where each patient bed has a dedicated monitor showing heart rate and temperature; the nurse can assess the entire ward’s status in seconds. Similarly, a data center technician can quickly scan a row of servers and spot the one with a flashing temperature alert or a failed fan warning. Doesn’t this local visibility simplify root cause analysis during an outage? Furthermore, by offloading simple status checks to the display, it reduces the constant load on network-based monitoring systems. Therefore, the bar LCD becomes a first line of defense, enabling proactive maintenance and minimizing the mean time to repair for physical hardware issues.
What are the key considerations for integrating a1U LCD into an existing server setup?
Integrating a1U LCD into an existing server requires careful planning around physical mounting, data sourcing, software configuration, and power delivery. You must ensure the display fits your chassis bezel, that your server OS or BMC can supply the necessary metrics, and that the display’s software or SDK is compatible with your infrastructure for a seamless and functional installation.
Successful integration of a1U LCD is a multi-stage process that blends hardware compatibility with software orchestration. The first consideration is physical: does your server’s1U front bezel have a cutout or can one be modified to accommodate the display panel? Many displays from providers like CDTech are designed as drop-in replacements for optical drive bays or come with universal mounting kits. The second, and more complex, layer is data integration. The display is merely a output device; it needs a software agent or driver installed on the host server to collect system statistics. This agent must be compatible with your operating system, whether it’s Windows Server, Linux, or a hypervisor like VMware ESXi. It needs secure, low-level access to pull data from the CPU, memory, network interfaces, and storage controllers. For instance, setting this up is similar to installing a new dashboard instrument in a car; you need to tap into the right sensor wires to get accurate readings. What happens if the monitoring agent conflicts with existing security or performance tools? How do you ensure the display continues to function during an OS kernel panic? Subsequently, you must plan for power, typically via an internal USB header or an external adapter, and network configuration if the display has its own IP for remote management. A thorough pre-installation checklist covering these points prevents post-installation surprises and ensures the display adds genuine value rather than becoming a dormant accessory.
Which features differentiate professional-grade1U monitoring displays from basic units?
Professional-grade1U monitoring displays are differentiated by superior build quality, wider compatibility, advanced software APIs, and enhanced reliability features. They offer higher brightness for data center lighting, broader operating temperature ranges, support for multiple data protocols, and robust SDKs for custom development, ensuring they perform reliably24/7 in demanding environments compared to basic consumer-oriented units.
| Feature Category | Professional-Grade Display (e.g., CDTech Solutions) | Basic Consumer Unit |
|---|---|---|
| Display Quality & Durability | High-brightness (≥300 nits) TFT with wide viewing angle, metal bezel, designed for24/7 operation in0-50°C environments. | Standard brightness LCD, plastic construction, rated for intermittent use in office temperature ranges. |
| Software & Integration | Comprehensive SDK with APIs for Windows/Linux, support for SNMP, IPMI, and custom scripts. Allows display of any system variable. | Limited proprietary software, may only display pre-set information like CPU load or temperature with minimal customization. |
| Connectivity & Control | Dual interface support (e.g., USB + RS-232), hardware buttons for on-screen menu navigation, remote configuration via network possible. | Single USB connection for power and data, no physical controls, configuration reliant on host PC software. |
| Mounting & Compatibility | Includes universal1U rack brackets, optical drive bay adapters, and fits standard19″ rack width without modification. | May require custom fabrication or adhesive mounting, not guaranteed to fit all rack chassis designs. |
How can server administrators customize the data shown on these bar LCDs?
Server administrators customize data on bar LCDs primarily through vendor-provided software tools, APIs, or scripting. This allows them to define which system metrics are displayed, their layout, refresh rate, and even trigger visual alerts for threshold breaches. Customization turns a generic display into a tailored monitoring dashboard specific to the server’s role, such as a database, web host, or virtualization node.
Customization is the process that transforms a standard display into a mission-specific dashboard, and it typically involves several layers of control. Most professional displays come with a configuration utility that provides a graphical interface for selecting common metrics from a list—CPU usage, memory consumption, network I/O, disk space, and temperature. However, the real power lies in the application programming interface (API) or software development kit (SDK). These allow administrators to write scripts in languages like Python, PowerShell, or Bash to query virtually any system parameter or application-specific metric. For example, a server running a MySQL database could have its LCD configured to show query cache hit rate, number of connections, and replication lag instead of just generic CPU load. Think of it as programming the headlines on a news ticker tape to show exactly the stories you care about. What metrics would give you the most insight into your application’s health at a glance? How can you design the display layout to be readable from a few feet away? As a result, the display becomes an extension of your monitoring philosophy. Furthermore, companies like CDTech often provide sample code and active developer support, which lowers the barrier to creating sophisticated, real-time visualizations that directly support operational decision-making on the data center floor.
What are the primary challenges in deploying1U LCDs at scale and how are they overcome?
Deploying1U LCDs at scale presents challenges in consistent configuration management, software deployment, physical installation logistics, and ongoing maintenance. Overcoming these requires automated provisioning tools, centralized management software if available, standardized server images with pre-installed drivers, and clear documentation to ensure every unit displays the correct information reliably across hundreds or thousands of servers.
| Challenge | Description | Mitigation Strategy |
|---|---|---|
| Mass Configuration | Manually setting up each display for hundreds of servers is time-consuming and error-prone, leading to inconsistent monitoring views. | Use automated scripts pushed via configuration management tools (Ansible, Puppet) to install drivers and apply standardized display templates. |
| Software Compatibility | Ensuring the display driver/agent works across diverse server hardware, OS versions, and security policies without conflicts. | Test the agent extensively in a staging environment that mirrors production. Choose vendors like CDTech that offer robust, kernel-agnostic software. |
| Physical Installation | Coordinating the installation of hardware displays into live server racks without causing downtime or disrupting cable management. | Schedule installations during maintenance windows. Use displays with tool-less, quick-release designs to minimize installation time per server. |
| Long-Term Reliability | Displays must operate continuously in harsh environments; a high failure rate would create more work than the value provided. | Source displays from manufacturers with a proven track record in industrial components, checking MTBF ratings and warranty terms. |
Expert Views
“The strategic value of1U rack LCDs is often underestimated. In modern DevOps and SRE practices, visibility is everything. While we have fantastic cloud-based monitoring suites, they introduce a dependency on the network and the monitoring stack itself. A local hardware display provides a fallback visibility layer that is always on, independent of network storms or agent failures. It’s particularly invaluable during ‘hands-on’ maintenance, data center migrations, or when bringing up a management network. The key is to not just display generic stats, but to use the programmability of quality units to show the two or three metrics that are the true canaries in the coal mine for that specific server’s function. This turns the display from a novelty into a legitimate tier-zero diagnostic tool.”
Why Choose CDTech
Choosing a provider like CDTech for1U server monitoring displays brings advantages rooted in specialized manufacturing expertise and a solutions-oriented approach. With over a decade focused on TFT LCD and touch technology, CDTech understands the engineering required for reliable, continuous-operation displays in controlled environments like data centers. Their experience in custom sizes and integrations means they can often accommodate unique bezel or interface requirements that standard off-the-shelf units cannot. Furthermore, their position as a solution provider, not just a component seller, typically translates into better technical support and more robust software tools for data integration. This combination of hardware proficiency and support for the complete integration cycle helps ensure that the deployment of these monitoring displays is successful and adds tangible operational value, reducing the burden on internal IT teams.
How to Start
Beginning with1U server monitoring displays involves a methodical, pilot-based approach. First, clearly define the problem you aim to solve: is it reducing mean time to identification during outages, simplifying hardware audits, or providing local status for network-isolated servers? Next, select a single, non-critical server or a test bench unit for a proof of concept. Source a display from a reputable manufacturer and focus on the integration process: physically mount it, install the necessary software drivers, and configure it to display a few key metrics. Test it thoroughly under various server loads and failure simulations. Document the steps, challenges, and time investment. Use the insights from this pilot to create a standardized deployment playbook, evaluate the true ROI, and then plan a phased rollout to critical servers first, ensuring each phase is reviewed and optimized before proceeding to the next.
FAQs
Can these LCDs display information if the server’s main operating system crashes?
It depends on the data source. If the display is powered by and reads data solely from the OS via a software agent, it will likely fail when the OS halts. However, many advanced setups can source data from a baseboard management controller (BMC) like IPMI, which operates independently of the main OS. Configuring the display to pull stats from the BMC ensures continued visibility into hardware health like power status and temperature even during a severe OS crash.
What is the typical lifespan of a1U rackmount LCD display?
The typical lifespan of a quality1U rackmount LCD designed for24/7 operation is substantial, often rated for50,000 hours or more of continuous use. This equates to over five years of non-stop runtime. Lifespan is primarily influenced by the quality of the LCD panel and backlight components, as well as the operating temperature. Ensuring adequate airflow around the display within the server chassis is crucial to maximizing its operational life.
Are these displays compatible with both Windows and Linux server environments?
Professional-grade1U monitoring displays from established manufacturers are typically compatible with both major server operating systems. The key is the availability of the software agent or SDK for each platform. Reputable providers like CDTech usually offer dedicated drivers and configuration tools for Windows Server editions and major Linux distributions such as Ubuntu, CentOS, and Red Hat Enterprise Linux. Always verify OS compatibility in the product specifications before purchase.
Implementing1U server monitoring with ultra-thin bar LCDs is a strategic decision that enhances physical-layer observability in data centers. The key takeaways are the importance of selecting a display with the right technical specs for integration, leveraging its programmability to show mission-critical data, and planning meticulously for deployment at scale. This technology serves as a reliable, immediate interface to server health, complementing sophisticated remote monitoring systems. For actionable next steps, start by auditing a handful of your most critical racks to identify servers that would benefit most from local status display. Then, engage with a technical provider to run a focused pilot, using the experience to build a business case and a repeatable process for broader implementation, ultimately aiming to reduce operational friction and improve your team’s response time to hardware incidents.
Post Search
Related Articles
-
Capacitive vs Resistive Touch Screen Car Stereo: Which Is Right for You?
-
TN LCD vs IPS LCD: How to Choose the Right Display for You
-
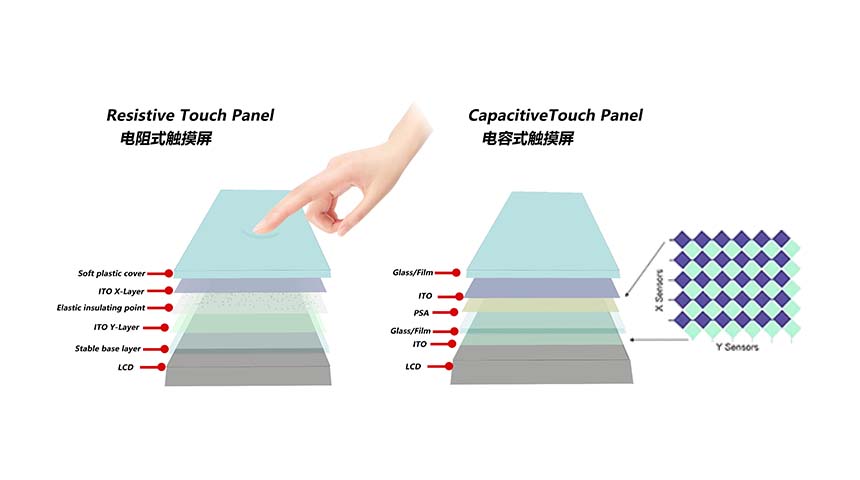
Capacitive Touch Panel or Resistive: Which Suits Your Needs?
-
Why Choose an IPS LCD Panel for Your Next Screen Purchase?
-
CDTECH to Showcase Cutting-Edge Display Solutions at SID 2025
-
Comparing Different Types of Displays in Cars: A Detailed Overview
-
White Spots on LCD Screen: Causes, Fixes & Industrial Solutions (2026 Guide)