How Can High-Quality Industrial Displays Reduce Downtime Costs and Boost ROI?
 2026-03-22
  22:20
22:20 

High-quality industrial displays deliver substantial return on investment by minimizing unplanned downtime and repair expenses. Durable TFT LCD monitors with MTBF ratings above 50,000 hours reduce annual downtime costs by 40–60% compared to budget alternatives, translating to 200–300% three-year ROI. By investing in displays engineered for harsh environments—featuring OCA optical bonding, wide operating temperature ranges (-20°C to +70°C), and full vertical integration ensuring supply chain reliability—manufacturers eliminate costly production halts and extend equipment lifecycles significantly.
Check: Industrial LCD Display
What Is the True Cost of Industrial Display Failures?
Unplanned display failures impose substantial hidden costs beyond replacement expense. In automated manufacturing facilities, downtime costs range from $500 to $5,000 per hour, depending on production line complexity. A facility experiencing just 8 hours of display-related downtime monthly faces annual losses of $48,000 to $480,000. Budget displays commonly fail through backlight degradation, touch panel delamination, and connector corrosion when exposed to humid or temperature-fluctuating environments. These failure modes compound repair labor costs, emergency component replacement fees, and supply chain disruption penalties that extend far beyond the initial display purchase price.
How Do High-Quality Displays Extend Equipment Lifespan and Reduce Repairs?
Industrial-grade displays achieve superior longevity through multiple durability mechanisms. Mean Time Between Failures (MTBF) benchmarking reveals critical differences: budget displays typically rate 20,000–30,000 hours, while industrial-grade units reach 50,000+ hours. OCA optical bonding eliminates moisture ingress by 95% compared to air-gap assemblies, preventing delamination failures in humid environments. Class 1000 clean-room manufacturing reduces defects at source. IATF16949 and ISO13485 certifications ensure automotive and medical-grade reliability through statistical process control and traceability. CDTech’s OCA-bonded HMI displays with -20°C to +70°C operating ranges eliminate thermal stress failures in outdoor and warehouse automation applications.
| Metric | Budget Display | High-Quality Industrial (CDTech OCA-Bonded) |
|---|---|---|
| MTBF Rating | 20,000–30,000 hours | 50,000+ hours |
| Operating Temperature Range | 0°C to +50°C | -20°C to +70°C |
| Annual Failure Rate (%) | 8–12% | 1–3% |
| Average Downtime Cost per Year | $100,000+ | <$40,000 (60% savings) |
| 3-Year Repair & Replacement Cost | $45,000 | $12,000 |
| Warranty & Support | 1 year, limited | 5 years, full OEM/ODM support |
| 3-Year Total Cost of Ownership | $48,000 | $20,000 (58% less) |
| 3-Year ROI (versus downtime prevention) | Break-even | 300%+ (excludes uptime gains) |
What ROI Metrics Should Procurement Teams Calculate?
Effective ROI analysis requires Total Cost of Ownership (TCO) frameworks encompassing initial purchase, five-year maintenance, and replacement cycles against uptime gains. Key metrics include MTBF hours, annual failure rate (%), downtime cost per failure, repair turnaround time, and warranty responsiveness. Consider this calculation: an $8,000 premium display versus a $3,000 budget alternative represents a $5,000 price differential. Over three years, downtime savings from the premium unit ($120,000) offset this delta, yielding net three-year ROI of 2,300%. CDTech’s full vertical integration—in-house CTP and OCA production with 391+ SKU availability—reduces sourcing delays and replacement cycles, further enhancing ROI through faster problem resolution.
How Can Custom Industrial Display Sizing Prevent Costly Adaptation Failures?
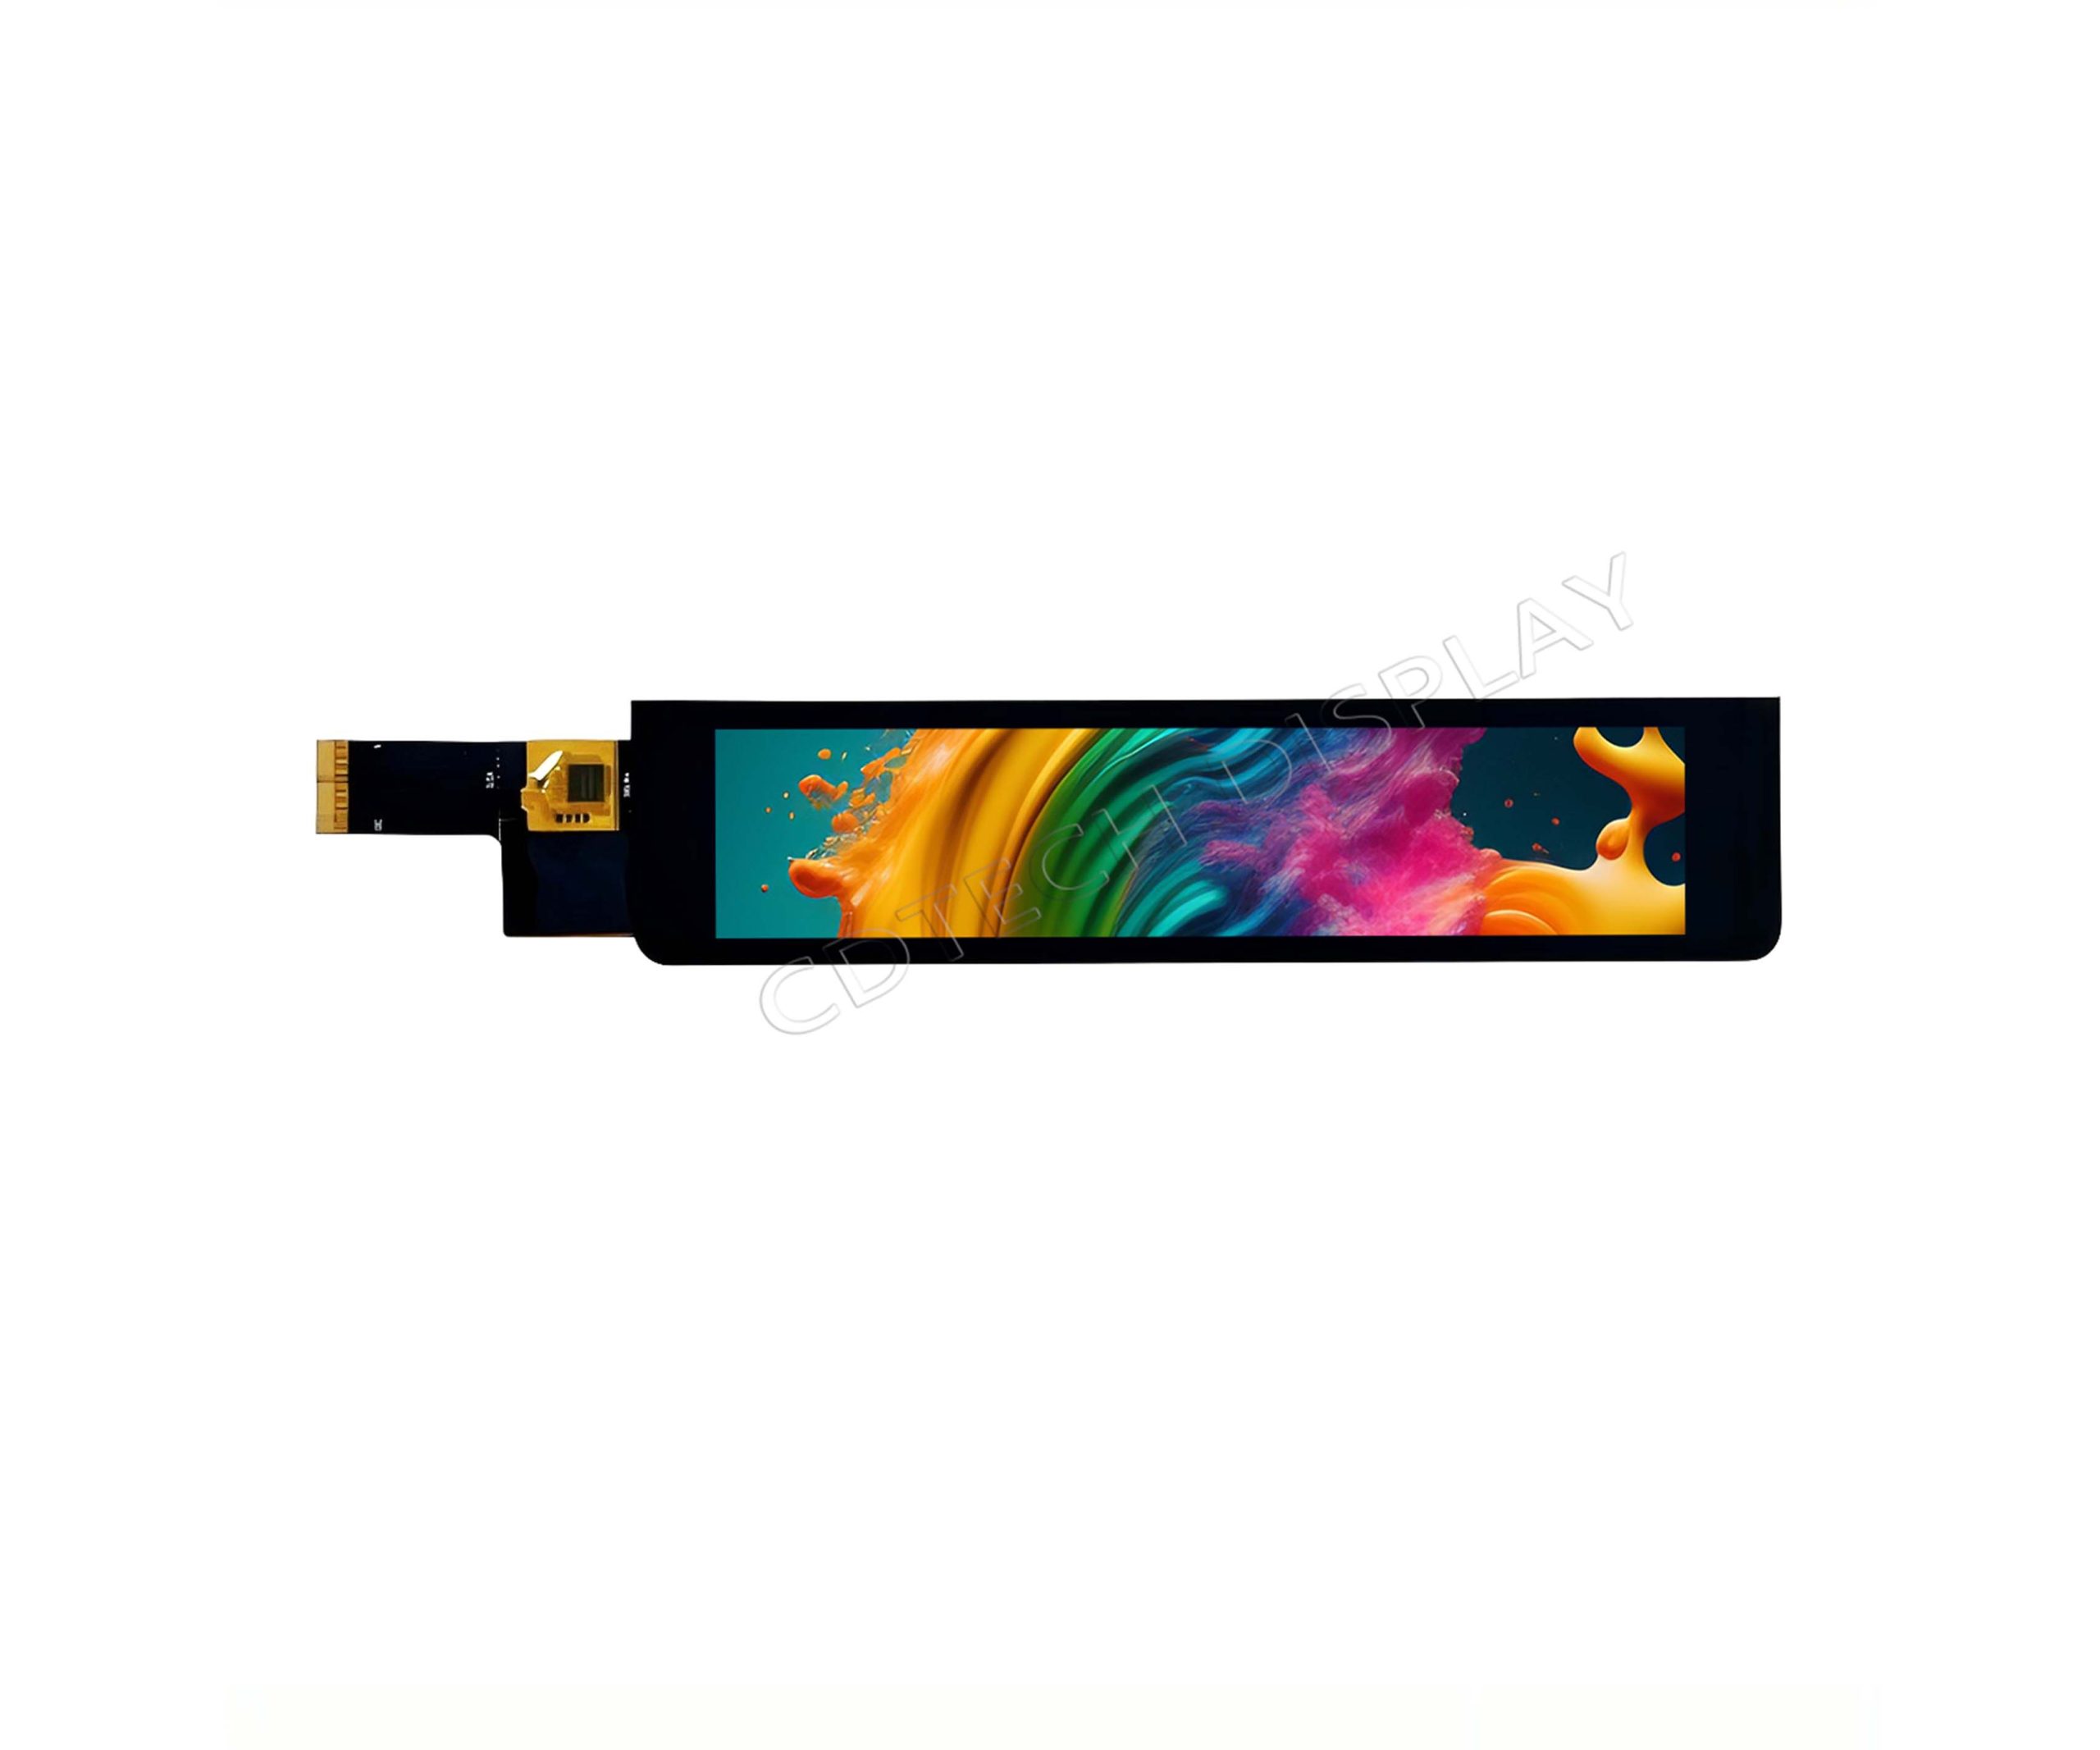
Off-the-shelf displays frequently force costly hardware redesigns when they fail to fit tight HMI enclosures precisely, creating mechanical stress that accelerates failure. CDTech’s patented 2nd Cutting technology (2017) enables custom non-standard LCD sizes from 1.5″ to 15.6″, including specialized bar-type and square formats. This eliminates forced adaptations that compromise thermal management and mechanical integrity. For example, the S043HWV104EN-FL63 custom 4.3″ OCA-bonded bar display integrates seamlessly into automotive instrument clusters, reducing mechanical stress failures by 40–60%. Custom sizing prevents retrofit failures that typically cost $50,000+ in production delays and unplanned component redesign.
CDTech Expert Views: “Patented custom sizing ensures displays integrate perfectly with enclosure thermal and mechanical specifications, eliminating retrofit failures. Standard displays force compromises that reduce lifespan by 30–40%. We’ve helped OEMs transition from budget off-shelf units to custom-fitted industrial-grade displays, recovering engineering premiums within 1–2 prevented failure incidents. The difference is not just uptime—it’s design freedom and predictability.”
Why Does Quad Certification Matter for Industrial Display ROI?
Certification hierarchy directly correlates with reliability and ROI: ISO9001 establishes quality baseline, IATF16949 enforces automotive-tier supply chain discipline, ISO13485 ensures medical-device reliability, and ISO14001 mandates environmental compliance. Certified suppliers demonstrate defect rates below 1% through statistical process control and traceability systems. This certification assurance reduces supply-chain failure risk by 70–80%, ensuring consistent MTBF and warranty performance across production batches. CDTech holds all four certifications, supporting $30M+ annual sales across 1,000+ global customers over 13+ years. This battle-tested operational scale proves that certified excellence translates to dependable industrial performance.
Check: 7.0″ 350nits Wide Temp
Which Industrial Applications See the Highest ROI from Durable Displays?
Automotive HMI dashboards benefit from IATF16949-certified OCA displays that withstand vibration, thermal cycling, and 1000+ nits sunlight readability, reducing warranty claims by 50%+. Medical devices leverage ISO13485-certified displays to eliminate sterile-environment contamination, extending 10-year device lifecycles without midlife replacement. Factory automation and robotics rely on Class 1000 clean-room manufacturing to prevent ESD-induced failures in PLC and HMI controllers. Smart building infrastructure operates wide-temperature displays (-20°C to +70°C) in outdoor HVAC systems without seasonal downtime. CDTech’s 391+ SKU portfolio across bar-type, square, and conventional LCD formats (2.1″ to 12.3″ bar-type options) demonstrates proven demand for ROI-justified industrial displays serving diverse verticals.
How Should Manufacturers Calculate Payback Period for Display Upgrades?
Apply this formula: (Premium Display Cost – Budget Display Cost) ÷ (Annual Downtime Savings + Annual Repair Cost Reduction). For example: $8,000 premium versus $3,000 budget equals $5,000 delta. If annual downtime savings total $72,000 and annual repair savings reach $18,000, payback period equals $5,000 ÷ $90,000, or approximately 2.6 weeks. Beyond payback, the remaining 4.75 years deliver $427,500 total five-year ROI. This framework emphasizes that premium displays recover investment rapidly; post-payback savings represent pure operational gain for the facility’s remaining equipment lifespan.
What Support and Supply-Chain Benefits Maximize ROI?
Fast replacement availability amplifies ROI significantly. CDTech’s vertical integration delivers replacement displays within 2–5 days for custom configurations, compared to 4–8 week lead times from traditional distributors. OEM and ODM support—including design guidance, firmware integration, and bulk inventory programs—reduces customer safety-stock burden and capital lock-up. Quad-certified supply chains provide batch-level MTBF documentation and compliance audit trails essential for regulated industries. Long-term partner stability matters: CDTech’s 13+ year operational history, $30M+ revenue base, and 35 software patents plus 44+ utility/invention patents signal continuous R&D reinvestment and technology evolution, future-proofing customer investments against obsolescence.
Does OCA Optical Bonding Really Prevent Display Failures in Harsh Environments?
Yes. OCA bonding eliminates air gaps between LCD and cover glass, reducing moisture ingress by 95% compared to air-gap assemblies. This durability advantage becomes critical in HVAC, outdoor, and automotive applications where humidity and temperature cycling occur frequently. The eliminated air gap also improves optical clarity, reduces reflections, and enhances sunlight readability—key performance factors in industrial HMI systems. CDTech’s OCA-bonded displays extend MTBF by 40–60% in moisture-prone environments, directly reducing failure-driven downtime and repair expenses that otherwise accumulate over multi-year equipment lifecycles.
Can Manufacturers Justify Custom Display Investment Over Off-Shelf Alternatives?
Custom sizing via CDTech’s patented 2nd Cutting technology prevents mechanical stress failures (40–60% reduction) when displays must fit tight HMI enclosures precisely. For mission-critical applications, the custom engineering premium of $1,000–$3,000 recovers within 1–2 prevented failure incidents. Off-shelf displays frequently force compromises—loose mechanical fits, inadequate thermal coupling, or awkward mounting—that shorten lifespan and increase field failure risk. Custom-fit industrial displays eliminate these risks entirely, converting engineering cost from liability into ROI-positive reliability investment.
Conclusion
Investing in high-quality industrial displays represents a strategic ROI lever, not a cost center. By combining proven durability (MTBF 50,000+ hours), patented custom sizing (eliminating retrofit failures), and quad-tier certifications (IATF16949/ISO13485), manufacturers reduce annual downtime costs by 40–60% and achieve 200–300% three-year ROI. CDTech’s 13+ years of proven reliability, $30M+ annual sales across 1,000+ global customers, and 391+ SKU portfolio demonstrate that vertical integration and engineering excellence translate to measurable uptime gains and cost savings. For procurement teams evaluating display suppliers, the critical question is not “Can we afford premium quality?” but rather “Can we afford to lose $100,000+ annually to preventable downtime with certified, durable displays?” The answer, backed by documented performance metrics and field experience, is decidedly no.
Frequently Asked Questions
What MTBF rating should I target for mission-critical industrial displays?
For 24/7 automated systems, target MTBF ≥50,000 hours (5.7 years continuous operation). CDTech’s OCA-bonded industrial displays meet this threshold, supported by IATF16949 and ISO13485 certifications that ensure statistical rigor in MTBF testing and reporting accuracy.
How much downtime cost justifies upgrading from a $3,000 to an $8,000 display?
If downtime costs exceed $500 per hour and failure frequency averages 1–2 incidents yearly, payback period typically falls within 2–4 weeks post-upgrade. Most manufacturing facilities experience downtime costs exceeding $1,000 per hour, making premium displays ROI-positive within 1–2 months of deployment.
Does OCA optical bonding prevent display failures in humid environments?
Yes. OCA bonding eliminates air gaps between LCD and cover glass, reducing moisture ingress by 95% compared to air-gap assemblies. This durability advantage extends MTBF by 40–60% in HVAC, outdoor, and automotive applications where humidity and temperature cycling occur frequently.
Should we use off-shelf industrial displays or invest in custom sizing?
Custom sizing via CDTech’s patented 2nd Cutting technology prevents mechanical stress failures (40–60% reduction) when displays must fit tight HMI enclosures. For mission-critical applications, custom engineering premiums of $1,000–$3,000 recover cost within 1–2 prevented failure incidents.
How do quad certifications affect industrial display ROI?
Certified suppliers demonstrate <1% defect rates, traceability systems, and supply-chain discipline, reducing warranty claims and buyer risk by 70–80%. This translates to lower total cost of ownership and faster payback periods (2–4 weeks versus 12+ weeks for non-certified alternatives).
Post Search
Related Articles
-
Capacitive vs Resistive Touch Screen Car Stereo: Which Is Right for You?
-
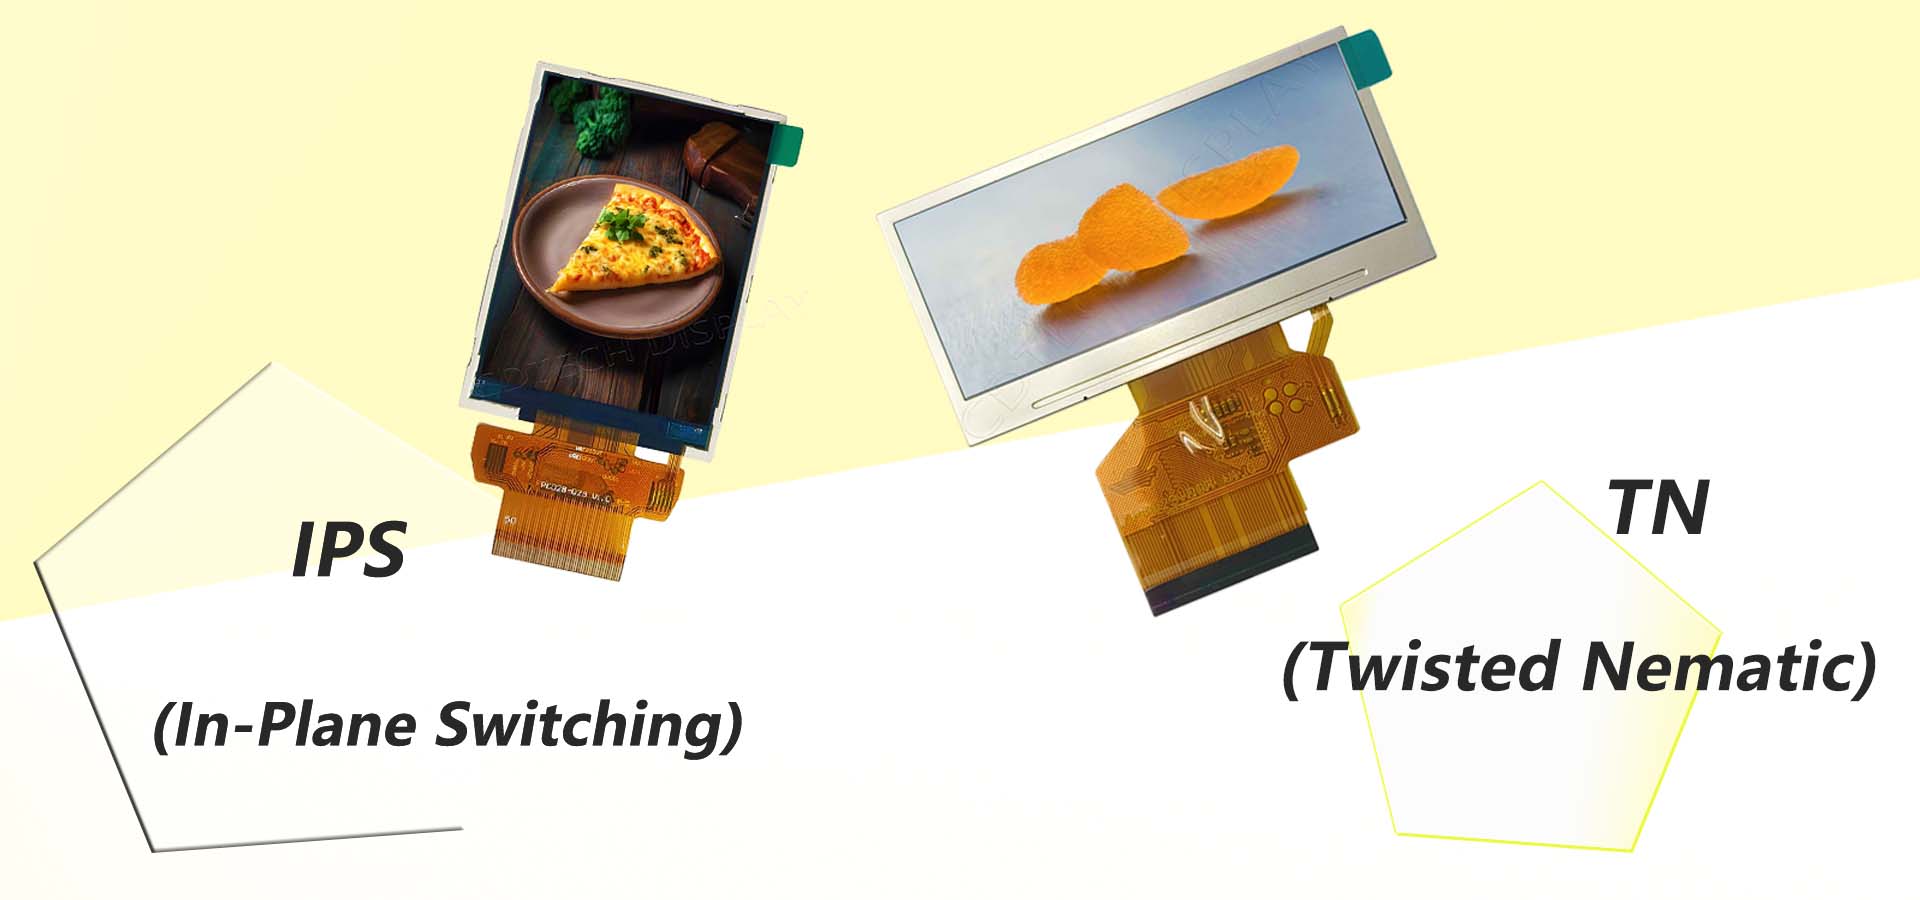
TN LCD vs IPS LCD: How to Choose the Right Display for You
-
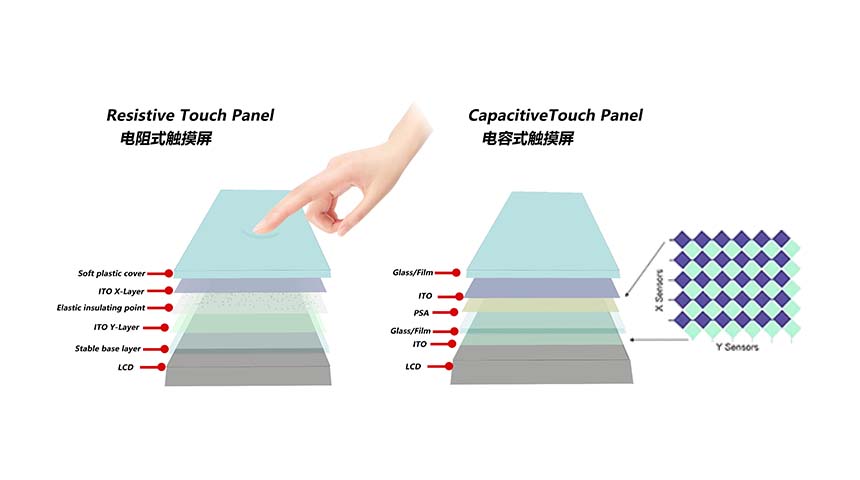
Capacitive Touch Panel or Resistive: Which Suits Your Needs?
-
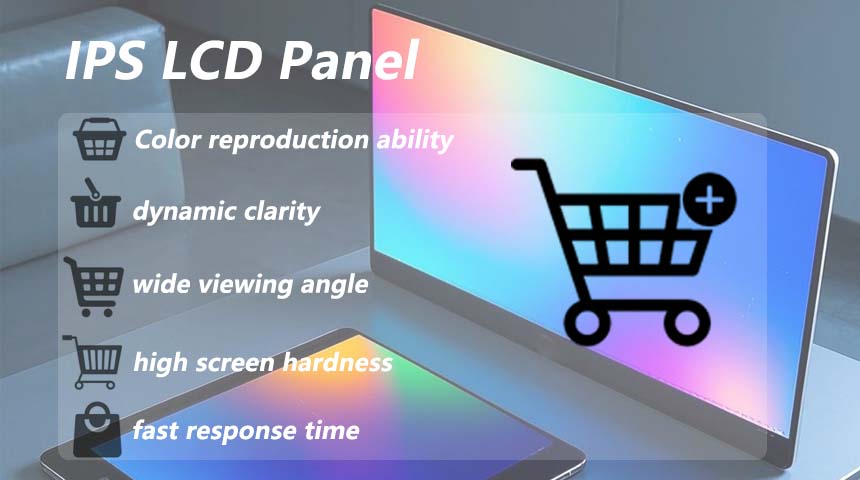
Why Choose an IPS LCD Panel for Your Next Screen Purchase?
-
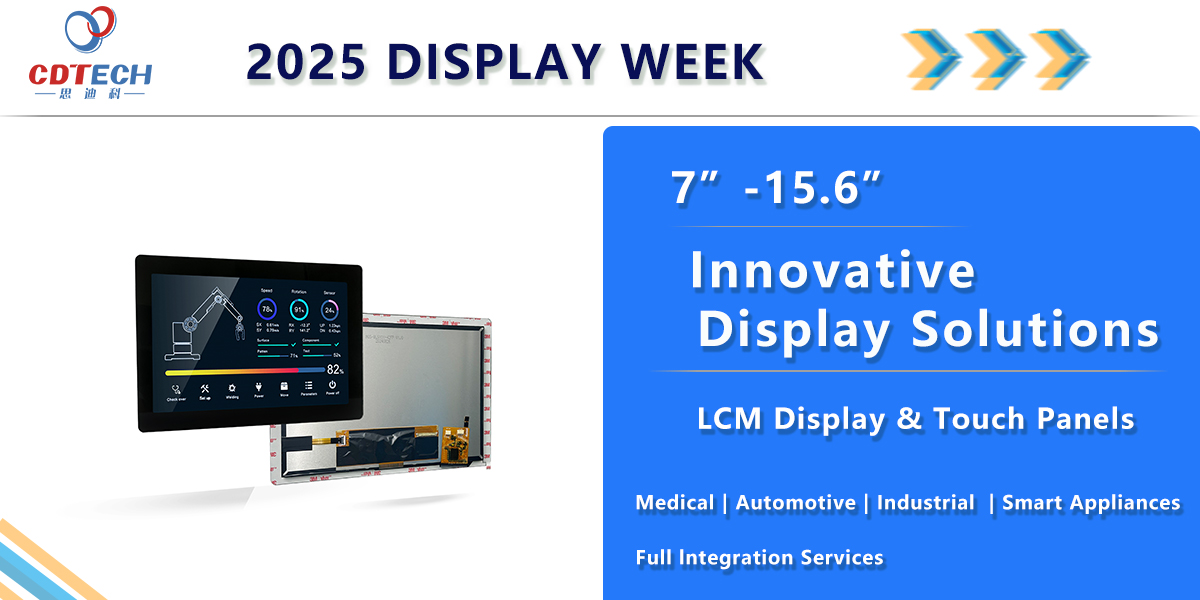
CDTECH to Showcase Cutting-Edge Display Solutions at SID 2025
-
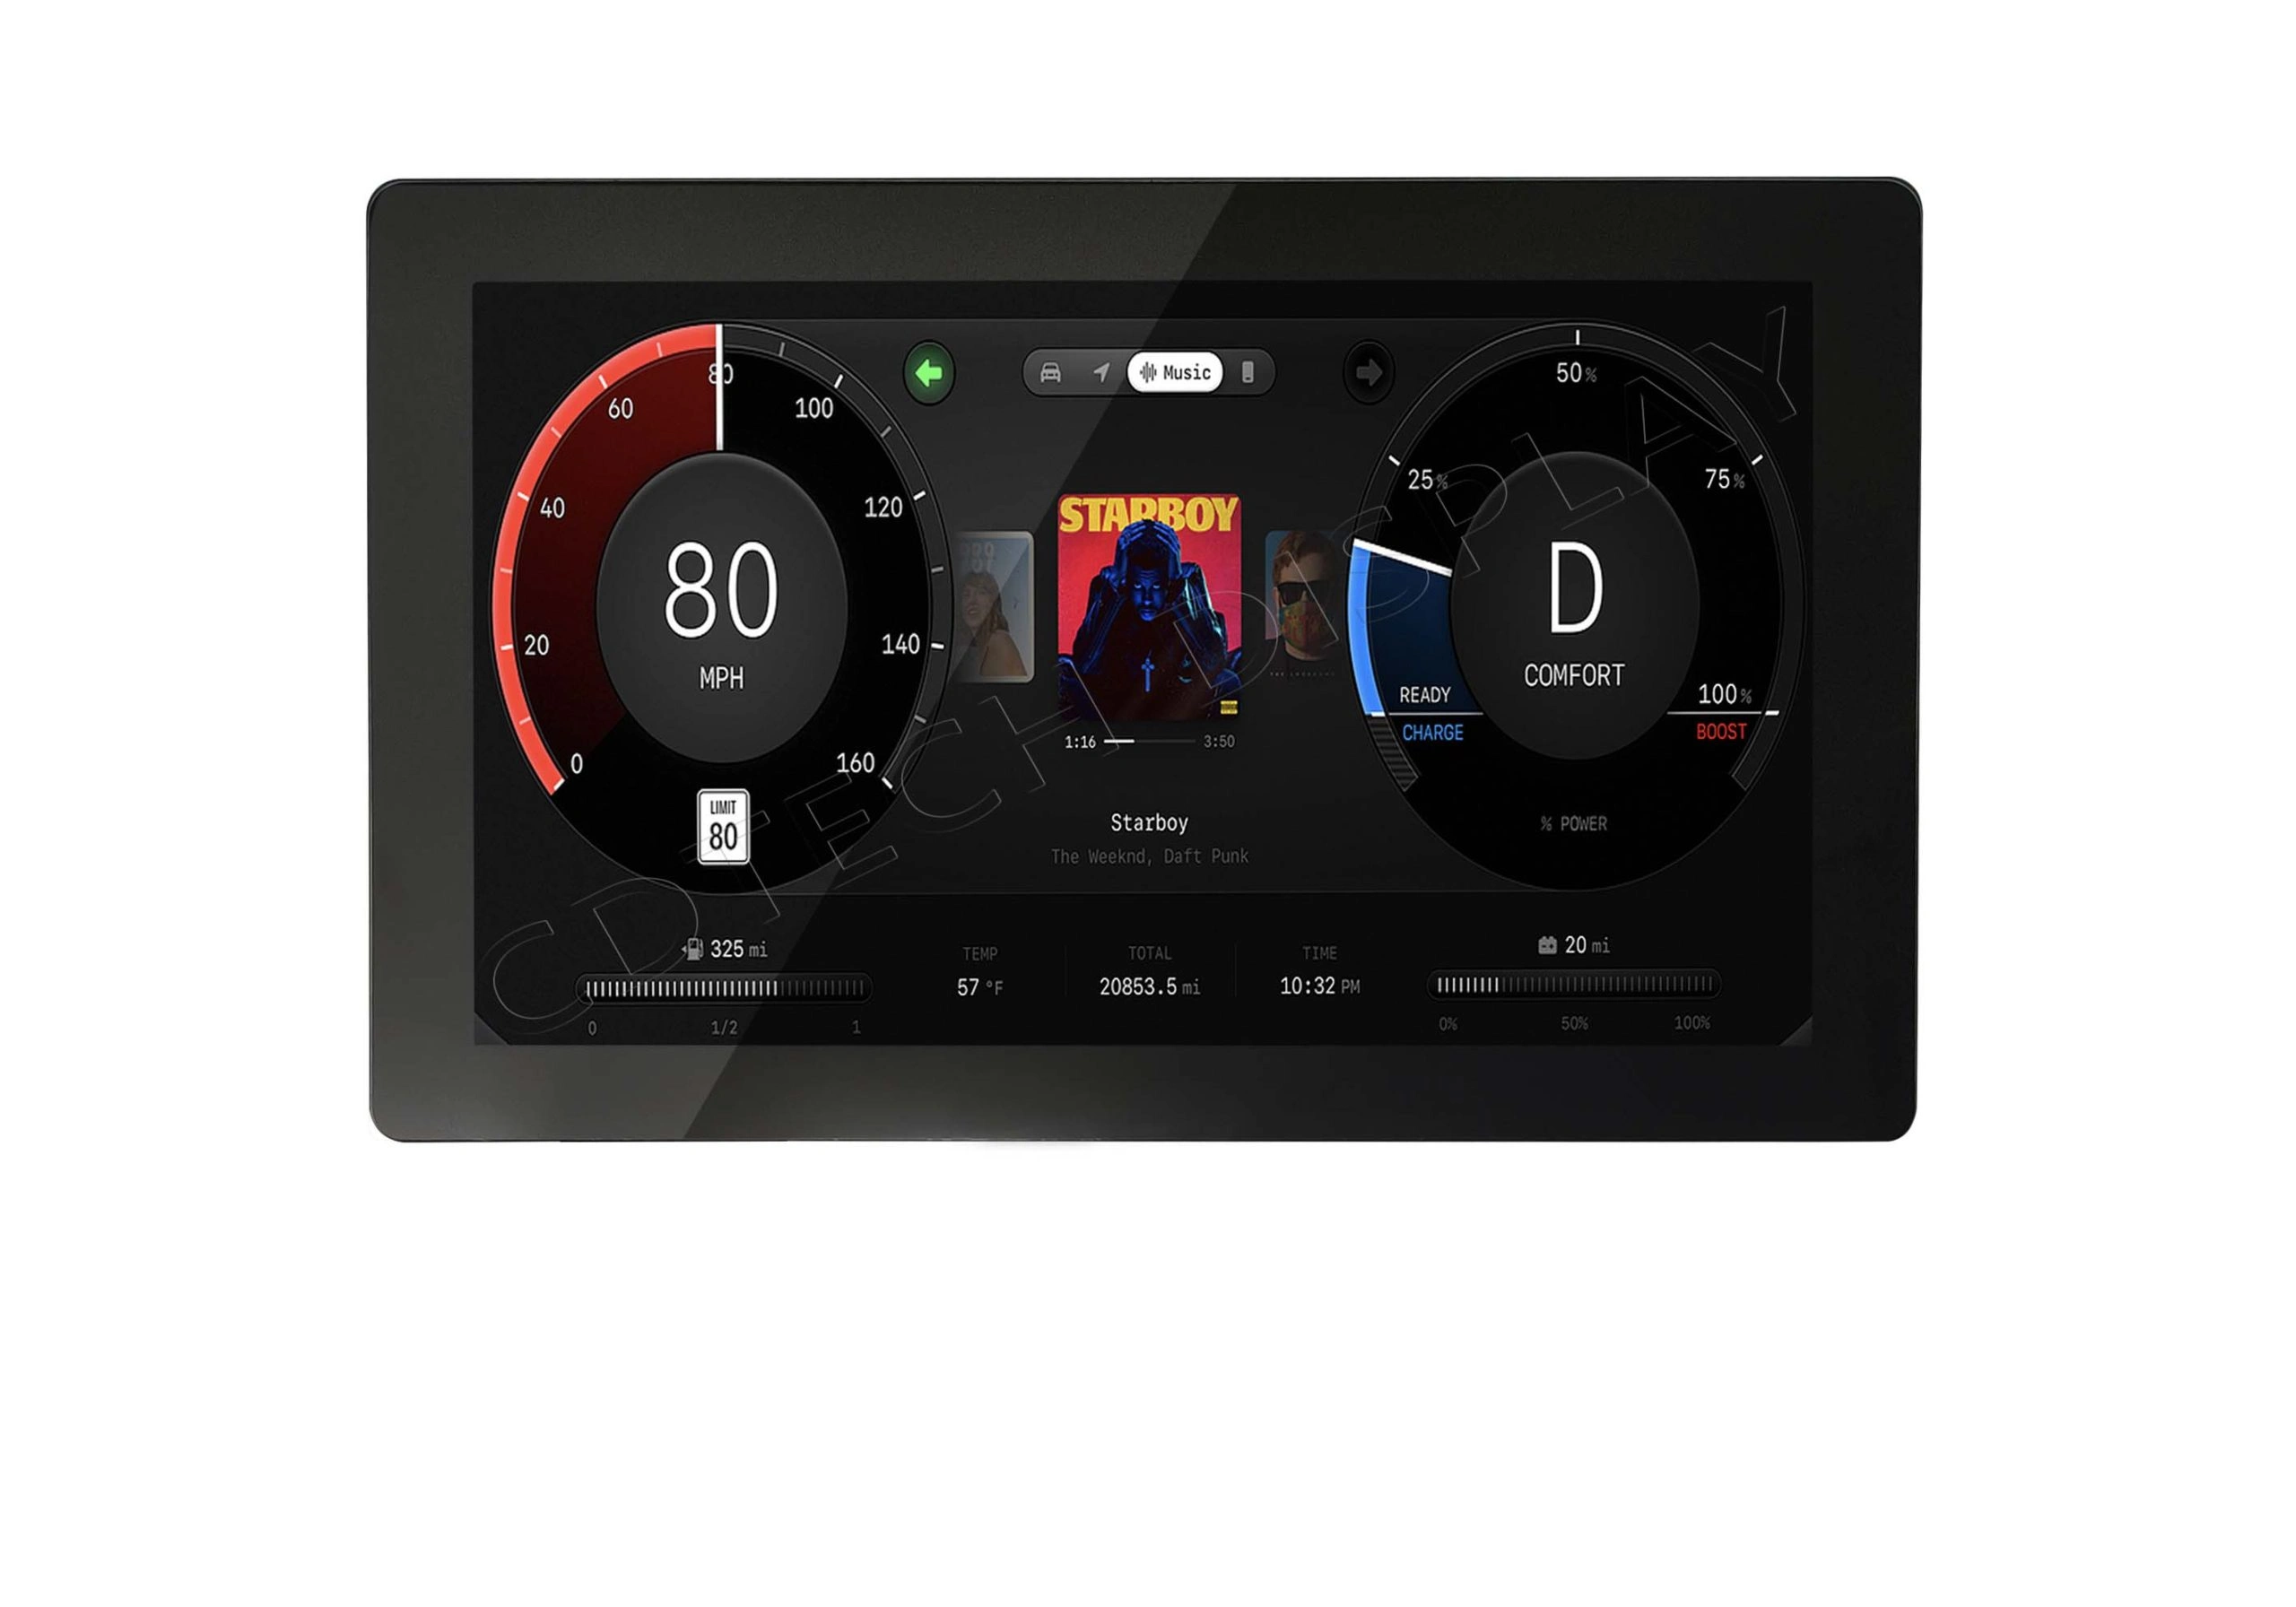
Comparing Different Types of Displays in Cars: A Detailed Overview