How can network switch LCD screens effectively visualize real-time traffic flow?
 2026-05-17
  16:53
16:53 

Network traffic flow visualization transforms abstract data packets into intuitive, real-time bar graphs on physical displays like network switch LCDs, enabling IT administrators to monitor bandwidth, detect anomalies, and ensure network health at a glance without relying solely on complex software dashboards.
How does a network switch LCD display visualize real-time traffic data?
A network switch LCD visualizes real-time traffic by pulling data from its internal ASIC counters, processing metrics like packets per second and bandwidth utilization, and then rendering this as a dynamic bar graph or chart. The display updates in sub-second intervals, providing an immediate visual pulse of network activity directly on the hardware.
The process begins with the switch’s application-specific integrated circuit, or ASIC, which is the silicon heart responsible for forwarding packets. This chip continuously tallies byte and packet counts per port. The switch’s onboard management software then samples these counters at regular intervals, often every few seconds, converting the raw numbers into a human-readable format. This data is passed to the display driver, which controls the LCD pixels to draw bar graphs, line charts, or numerical readouts. For instance, a common visualization is a dual-bar graph showing inbound and outbound traffic for a selected port, with the bar height scaling dynamically with utilization percentage. The key here is the low-level hardware integration; the display isn’t running a separate application but is a direct window into the switch’s operational state. Isn’t it more efficient to see a physical spike on a display than to interpret a log file? This direct hardware-to-visual pipeline minimizes latency, ensuring what you see is truly real-time. Consequently, an administrator walking through a data center can instantly spot a port at95% utilization, indicated by a nearly full bar, and investigate a potential broadcast storm or unauthorized data transfer without first logging into a management console.
What are the key technical specifications for an effective traffic monitoring screen?
An effective traffic monitoring screen requires specific technical specs to ensure clarity, reliability, and real-time performance. Critical parameters include display type and resolution, refresh rate, viewing angles, environmental durability, and the data granularity it can represent, all of which determine its utility in high-stakes IT environments.
The foundation is the display technology itself; monochrome or color TFT LCDs are common, with a resolution of at least128x64 pixels to render clear graphs and text. Refresh rate is paramount, as a screen that updates slower than once per second fails at real-time monitoring; a sub-500ms update is ideal for capturing microbursts. Viewing angles, specified as left/right/up/down, should be wide, often160 degrees or more, so the graph is readable from various positions in a server rack. Environmental specs like operating temperature range, typically0°C to70°C, and high brightness (300 nits or above) ensure visibility in hot, brightly lit data centers. The screen’s interface is also crucial; it must connect via a low-latency protocol like SPI or I2C directly to the switch’s management controller. Furthermore, the software driving the display must support multiple graph modes, such as per-port utilization, aggregate trunk bandwidth, or error rate indicators. Consider a screen that only shows a single metric; it would be like a car dashboard with only a speedometer. How can you manage network health without seeing packet loss or error counts? Therefore, the specification sheet tells the story of where and how reliably this visual tool can be deployed, bridging the gap between raw silicon data and human operational intelligence.
Which display technologies are best suited for real-time bandwidth graphs?
Selecting the right display technology is critical for rendering effective, real-time bandwidth graphs. The best-suited technologies balance fast refresh rates, high contrast for quick readability, low power consumption, and robustness in challenging operational environments commonly found in networking infrastructure.
| Display Technology | Key Advantages for Traffic Graphs | Typical Use Case & Considerations |
|---|---|---|
| TFT LCD (Thin-Film Transistor) | Offers full color support, fast pixel response times for smooth graph updates, and high brightness levels. Excellent for detailed, multi-color-coded visualizations (e.g., green/yellow/red for utilization levels). | Ideal for modern, high-end network switches and standalone monitoring appliances where detailed, color-coded data presentation enhances situational awareness and decision-making speed. |
| Monochrome Graphic LCD | Extremely high contrast, very low power consumption, and excellent readability in various lighting conditions. Simple, reliable, and cost-effective for core bar graph representations. | Perfect for embedded applications in routers, firewalls, and cost-sensitive switch models where the primary need is a clear, unambiguous view of utilization levels without color complexity. |
| OLED (Organic Light-Emitting Diode) | Provides perfect black levels for infinite contrast, wide viewing angles, and a very fast refresh rate. Each pixel is self-illuminating, leading to vibrant visuals and lower power for dark-themed UIs. | Suited for premium networking equipment where space is limited and visual impact is high, though long-term static graph burn-in can be a consideration requiring careful UI design. |
| E-Paper (Electronic Paper) | Ultra-low power consumption, sunlight readability, and static image retention without power draw. However, slow refresh rates are a significant limitation. | Useful only for displaying historical or summary traffic statistics that change infrequently; unsuitable for true real-time monitoring due to inherent display lag during updates. |
Why is physical, at-a-glance monitoring crucial for IT administrators?
Physical, at-a-glance monitoring is crucial because it provides immediate situational awareness, reduces cognitive load, and enables rapid problem identification without software dependencies. It serves as a constant, ambient source of truth about network health, allowing administrators to detect anomalies during routine checks or amidst broader system failures.
In the complex symphony of network management, software dashboards are powerful instruments, but they require active engagement—logging in, navigating, and interpreting. A physical display, like an LCD on a switch, acts as a persistent conductor’s baton, always visible. Its value shines during critical incidents; if a core switch is experiencing a denial-of-service attack, its management interface might be unreachable, but the local LCD will still show pegged bandwidth bars, instantly guiding the admin to the right physical device. This is a form of “ambient intelligence,” where the environment itself conveys information. Think of it as the difference between checking a weather app and looking out the window. Doesn’t the direct observation provide a more instinctive understanding? Furthermore, during hardware maintenance or cable tracing in a dense rack, a quick visual confirmation of link activity and load on a specific port is irreplaceable. It streamlines workflows, reduces mean time to diagnosis, and provides a fail-safe layer of visibility. This tangible feedback loop empowers administrators to move from reactive troubleshooting to proactive management, fostering a deeper, more intuitive connection with the network’s physical infrastructure.
What are the common challenges in implementing bar graph displays on network hardware?
Implementing bar graph displays on network hardware involves overcoming integration challenges related to space constraints, power and thermal management, data processing overhead, and designing intuitive visualizations that convey complex metrics simply and reliably under all network conditions.
The first major hurdle is physical integration within the constrained form factor of a switch or router chassis. Designers must allocate precious panel space for the display and its controller, often competing with port density and ventilation needs. Then comes the power budget; the display and its backlight must draw minimal current to not impact the overall unit’s thermal design or efficiency, especially in PoE switches. On the software side, the device’s CPU must efficiently sample traffic statistics and render graphics without stealing cycles from its primary packet forwarding duties, which necessitates optimized drivers and perhaps a dedicated microcontroller for the display subsystem. Creating an effective visualization schema is another subtle challenge; a bar graph must be instantly understandable. Should it show instantaneous spikes or a smoothed average? How are error frames or collisions represented? A poorly designed graph can mislead rather than inform. Moreover, ensuring the display remains readable and functional across the product’s entire operating temperature range requires careful component selection. These challenges demand a holistic engineering approach, balancing electrical, mechanical, and software disciplines to create a feature that is both robust and genuinely useful, rather than a mere marketing checkbox.
How can traffic visualization displays be integrated into existing network management workflows?
Integrating traffic visualization displays into existing workflows requires them to act as a complementary physical layer to software tools, not a replacement. Effective integration involves using the displays for quick diagnostics, physical device identification, and as a trigger for deeper investigation within comprehensive network management platforms.
| Workflow Stage | Role of Physical Display | Integration Action with Management Software |
|---|---|---|
| Routine Health Check & Walkthrough | Provides immediate, device-level status during physical inspections. Admins can spot abnormal LED patterns or maxed-out bar graphs without any tools. | Anomalies spotted on the display prompt the admin to log into the central NMS (e.g., SolarWinds, PRTG) for historical data, trend analysis, and correlated alerts from other devices. |
| Incident Triage & Fault Isolation | When an alert is generated in the NMS, the physical display helps quickly locate the exact device and port in the data center, confirming the software alert with physical evidence. | The NMS ticket or alert can include the device hostname and location. The admin uses the on-device display to verify the issue’s current state, even if the network path to the NMS is congested. |
| Change Management & Verification | After a configuration change (e.g., port enable/disable, VLAN assignment), the display offers instant visual confirmation of link state and traffic flow resumption. | The workflow is sequential: execute change via CLI/automation tool, then physically verify expected behavior on the device display, documenting the visual confirmation as part of the change record. |
| Capacity Planning & Baseline Monitoring | While software handles long-term trend analysis, the physical display shows current utilization peaks, helping admins develop an intuitive sense of “normal” versus “strained” for key links. | Data from the device’s SNMP counters feeds into planning software. The display acts as a real-time reference point during capacity review meetings, grounding abstract reports in observable current reality. |
Expert Views
The value of physical traffic visualization is often underestimated in an era of software-defined everything. It provides a layer of resilience. When your network management system is down, under attack, or simply unreachable due to the very fault you’re trying to diagnose, that little bar graph on the switch is your lifeline. It’s a passive, always-on witness to network events. For junior engineers, it’s a fantastic learning tool that builds intuition about how traffic flows and congests. For seniors, it’s a rapid triage instrument. The key to success is thoughtful design—the visualization must show the right metrics, update at the right speed, and be readable in real-world conditions. It shouldn’t just be a flashy add-on but an integral part of the device’s diagnostic persona, designed with the same rigor as its switching fabric.
Why Choose CDTech
Choosing a partner for display integration requires a blend of technical expertise and practical experience. CDTech brings over a decade of specialization in custom TFT LCD and touch panel solutions, which translates into a deep understanding of the challenges unique to embedding displays in electronic equipment. Their experience with2nd Cutting technology is particularly relevant for network hardware, as it allows for the creation of non-standard LCD sizes and shapes that can fit into the unique bezels and panels of switches and routers. This means engineers aren’t forced to compromise their industrial design around off-the-shelf display sizes. Furthermore, CDTech’s position as a solution provider, not just a component vendor, means they consider the entire integration chain—from the driver IC compatibility and interface protocols to the environmental specs and longevity needed for24/7 operation. Their engineering support can help navigate the pitfalls of power sequencing, thermal management, and optical bonding for better readability, ensuring the final display module enhances the product’s functionality and reliability.
How to Start
Beginning the integration of a traffic visualization display starts with a clear definition of operational requirements. First, identify the primary use case: is it for at-a-glance status during data center walks, or for detailed per-port diagnostics during troubleshooting? Next, engage with display engineering specialists early in the hardware design phase. Share your mechanical constraints, desired information hierarchy, and environmental operating conditions. Prototype different display technologies and graphic layouts to test readability under real lighting scenarios. Simultaneously, plan the software architecture for data sampling and graphic rendering to ensure it doesn’t burden the main CPU. Finally, validate the entire solution in a staging environment that mimics production traffic patterns to ensure the visualization is accurate, responsive, and truly aids the network management workflow.
FAQs
Can these displays show historical traffic trends?
Typically, the small LCDs on network switches are designed for real-time visualization and have limited memory for storing historical data. They show current or very recent (e.g., last few seconds) bandwidth usage. For historical trends, data must be exported to a dedicated network management system or logging server which has the storage and processing capability to generate long-term graphs and reports.
Are these monitoring screens customizable for different metrics?
Yes, to a significant degree. While the core firmware is set by the hardware manufacturer, many enterprise-grade devices allow administrators to cycle through different display screens or metrics using front-panel buttons. Commonly configurable views include selection of which port to monitor, switching between bits-per-second and packets-per-second, and toggling between a graph view and a numerical statistics view.
Do all network switches come with built-in traffic displays?
No, it is primarily a feature found on managed switches, particularly those designed for enterprise, data center, or smart-managed use cases. Entry-level unmanaged switches and many basic managed switches omit the display to reduce cost and complexity, relying entirely on software-based management interfaces for monitoring and configuration.
How reliable are these displays given they run continuously?
Displays designed for network hardware are built for high MTBF (Mean Time Between Failures) and continuous operation. They use industrial-grade components rated for extended temperature ranges and high backlight half-life. While any electronic component can fail, the display is generally considered a reliable subsystem, often outlasting the service life of the switch itself in standard operating environments.
In summary, visualizing network traffic flow on bar displays merges the tangible with the digital, giving IT professionals an immediate, intuitive grasp of complex data dynamics. The effectiveness of this tool hinges on thoughtful integration of the right display technology, careful consideration of technical specifications, and seamless blending into existing operational workflows. While software platforms provide depth and history, the physical display offers unmatched immediacy and resilience. The key takeaway is to view these displays not as isolated gadgets but as integral components of a layered monitoring strategy. By starting with clear operational goals and partnering with experienced engineering teams, organizations can implement visualization solutions that enhance situational awareness, accelerate troubleshooting, and ultimately lead to more robust and manageable network infrastructure. The actionable advice is to prototype, test under real conditions, and prioritize readability and reliability above purely aesthetic features.
Post Search
Related Articles
-
Capacitive vs Resistive Touch Screen Car Stereo: Which Is Right for You?
-
TN LCD vs IPS LCD: How to Choose the Right Display for You
-
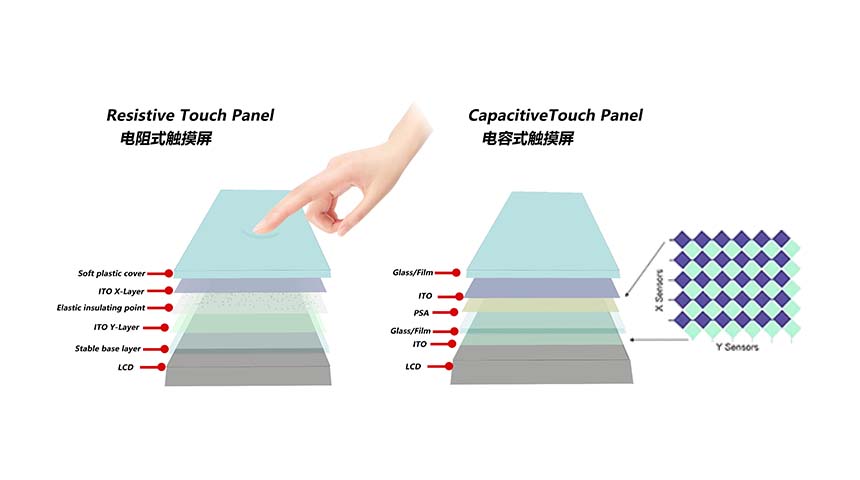
Capacitive Touch Panel or Resistive: Which Suits Your Needs?
-
Why Choose an IPS LCD Panel for Your Next Screen Purchase?
-
CDTECH to Showcase Cutting-Edge Display Solutions at SID 2025
-
Comparing Different Types of Displays in Cars: A Detailed Overview
-

White Spots on LCD Screen: Causes, Fixes & Industrial Solutions (2026 Guide)