
How can you interpret error codes using the on-board LED indicators?
 2026-05-18
  23:00
23:00 

On-board LED indicators provide an immediate, hardware-level diagnostic method, allowing engineers to interpret error codes directly from the controller board to efficiently debug LCD display failures without needing external tools.
How do on-board LED indicators work for hardware debugging?
On-board LED indicators are simple yet powerful diagnostic components integrated directly onto a controller board. They communicate system status through predefined blink patterns, colors, or steady states. This visual feedback offers a first line of defense in troubleshooting, revealing issues from power faults to communication errors before any software tools are even connected. It is a fundamental method for isolating hardware problems in embedded systems like those using CDTech display modules.
These indicators function by being connected to specific General-Purpose Input/Output pins or dedicated status pins on the main microcontroller or system-on-chip. The firmware is programmed to control these LEDs based on internal system checks. For instance, a common sequence might involve a power-on self-test where the LED blinks three times to confirm successful bootloader execution before the main application starts. The real value lies in the code, which is a pre-agreed language between the hardware and the developer. Interpreting a rapid double blink versus a slow single pulse is akin to understanding Morse code; each pattern corresponds to a specific checkpoint or failure mode in the initialization routine. Have you considered how much time is saved by not having to attach a debug probe for every minor fault? What if the system fails before the debug port is even initialized? In such scenarios, these LEDs are indispensable. For example, when a CDTech display controller fails to handshake with the host processor, a specific LED pattern can immediately point to an I2C communication fault, guiding the engineer to check the physical connection and pull-up resistors. Transitioning from basic power checks to complex state machines, these indicators provide a continuous visual log of the board’s operational health. Consequently, a well-documented LED scheme transforms a simple light into a critical diagnostic instrument, enabling faster root cause analysis and reducing mean time to repair in development and field service contexts.
What are the common error code patterns for LCD controller boards?
LCD controller boards utilize standardized and vendor-specific error codes displayed via LED patterns. Common patterns indicate fundamental issues like power supply problems, initialization failures, or communication bus errors. Understanding these patterns, which often involve combinations of long and short flashes, is essential for quick diagnosis. Manufacturers like CDTech typically provide detailed decoding charts in their technical manuals to aid in this process.
Decoding these patterns requires referencing the board’s specific documentation, but several universal conventions exist. A solid LED often signifies stable power and a passed primary self-test. A single, slow blink might indicate the system is in a low-power sleep mode or waiting for an input. More urgent are rapid or irregular patterns. For instance, two short blinks followed by a pause could signal a failure in initializing the display’s timing controller, while three short blinks might point to a fault in the frame buffer memory. Consider this analogy: just as a car’s dashboard uses different warning lights for engine oil pressure versus battery charge, an LCD controller uses distinct blink codes for its internal subsystems. Would you know where to start if your display remained blank but the LED showed a frantic, continuous blink? How can you distinguish a software configuration error from a genuine hardware fault? Often, a pattern involving a series of flashes, like “flash-flash-pause, flash-flash-pause,” is a hexadecimal representation of an error code stored in a register, which can be cross-referenced for precise diagnosis. Therefore, mastering these patterns is not about memorization but about understanding the board’s boot sequence and failure points. By learning the common language of these LEDs, you can swiftly move from observing a symptom to testing a specific hypothesis, such as verifying voltage levels on the display interface or re-flashing the firmware.
Which diagnostic steps follow an LED error code on a display module?
After observing an LED error code, a structured diagnostic process begins. This involves verifying power supply integrity, inspecting physical connections and solder joints, and checking signal lines with a multimeter or oscilloscope. The code narrows the search area, but systematic electrical validation is required to confirm the root cause, whether it’s a short circuit, an open connection, or a faulty component on the board.
The first step is always to consult the manufacturer’s error code documentation to translate the LED’s message into a suspected subsystem. For a code indicating a “display interface failure,” your immediate action should be to power down the unit and perform a visual inspection of the LCD flex cable connection and the connector itself for any signs of damage or misalignment. Next, with power restored, you would use a digital multimeter to check for the correct voltage on the power rails feeding the display panel, typically3.3V or5V, and sometimes a specific positive/negative voltage for the LCD bias. Following this, an oscilloscope becomes crucial to probe the critical control signals like the data enable (DE), pixel clock (PCLK), and horizontal/vertical sync lines to see if they are active and toggling at the expected frequencies. Isn’t it more efficient to probe a few specific signals rather than the entire board? What if the error code was misleading due to a secondary fault? Therefore, you must also consider the system context; a communication error between the main processor and the LCD controller could stem from a corrupted firmware image just as easily as from a broken trace. As a practical example, if a CDTech module shows a pattern for “I2C timeout,” you would sequentially check the pull-up resistor values on the SDA and SCL lines, measure the bus voltage, and then use a logic analyzer to capture the actual transaction. Ultimately, this methodical approach, guided by the initial LED clue, ensures a logical progression from symptom isolation to component-level verification, preventing unnecessary part replacements and saving valuable debugging time.
How can engineers design an effective LED debug system for a custom board?
Designing an effective LED debug system requires strategic planning during the PCB layout phase. Engineers must allocate dedicated GPIOs, define a clear and documented state machine for LED behavior, and consider multi-color LEDs for increased information density. The system should cover boot phases, operational states, and critical fault conditions, providing a non-intrusive way to monitor the board’s health throughout its lifecycle.
An optimal design starts with selecting the right hardware: using a bicolor or tricolor LED driven by separate GPIOs can exponentially increase the number of unique states without using extra board space. The firmware architecture must then implement a dedicated debug task or module that updates the LED state based on system events. This module should be prioritized to function even if other parts of the firmware crash. A robust design includes states for power-on, bootloader execution, application start, runtime normal operation, and specific error codes for each major driver initialization failure, such as DRAM, flash memory, or peripheral communication. Think of it as designing the instrumentation panel for an aircraft, where pilots need immediate, unambiguous status of critical systems. How many distinct error conditions should your LED system be able to communicate? Is it worth the extra GPIO pins to have a more verbose debug output? For instance, you could designate a sequence where a red steady light means a fatal power fault, a blinking red indicates a sensor failure, and a blinking yellow signals a warning like high temperature. Furthermore, integrating a simple button to cycle through different diagnostic modes via the LED can add field-service functionality. By planning this system early, you create a valuable tool that aids in development, production testing, and post-deployment support, ultimately reducing support costs and improving product reliability. This foresight demonstrates deep engineering expertise and a commitment to creating maintainable hardware.
What are the limitations of relying solely on LED indicators for debugging?
While invaluable, LED indicators have inherent limitations. They offer limited bandwidth and cannot convey complex data or variable values. They are also useless if the core controller or power section itself is dead. Furthermore, without proper documentation, the blink codes are cryptic. For deep, complex issues involving software logic or timing, more advanced tools like logic analyzers and in-circuit debuggers are essential.
The primary constraint is the low information density; an LED can only signal a category of error, not the precise memory address of a crash or the exact value of a corrupted register. It cannot help debug real-time data streams or subtle timing violations in a high-speed MIPI DSI interface. If the microcontroller responsible for driving the LED is non-functional due to a catastrophic power surge or a faulty crystal oscillator, the LED will remain dark, offering no diagnostic clue at all. This scenario is like having a silent alarm system during a power outage. How do you proceed when the very tool designed to help you is incapacitated? Can you trust an “all-clear” steady green light if a secondary voltage rail has failed but the main CPU is still running? Therefore, LED indicators are best viewed as a first-tier diagnostic tool within a broader hierarchy. They are excellent for identifying the subsystem at fault but must be supplemented with secondary methods. For example, a UART debug console can provide textual logs, and a JTAG/SWD probe allows for step-through debugging and memory inspection. A well-rounded debugging strategy uses the LED for immediate triage, then escalates to more sophisticated instruments to perform the detailed forensic analysis needed to resolve intricate hardware-software integration issues, ensuring no fault is beyond reach.
How do multi-color LEDs enhance diagnostic capabilities compared to single-color?
Multi-color LEDs, such as bicolor (red/green) or RGB types, significantly expand diagnostic capabilities by adding a color dimension to the state encoding. This allows for immediate distinction between status types—like green for normal, yellow for warning, and red for error—within the same physical footprint. It enables more intuitive and faster interpretation of complex system states without requiring the user to count blinks.
The enhancement is both quantitative and qualitative. Quantitatively, a single RGB LED controlled by three PWM-capable GPIOs can represent dozens of distinct states through combinations of color and blink pattern, whereas a single-color LED is limited to patterns of on/off durations. Qualitatively, color leverages pre-attentive human perception; our brains recognize red as a stop or error signal far faster than we can decode a sequence of four short pulses. This allows for instant severity assessment across a room or on a production line. Imagine a traffic light system versus a single flashing bulb; the information is conveyed much more efficiently. Doesn’t a steady red light immediately convey a more urgent situation than a slow green blink? How much could this reduce training time for field technicians? In practice, a CDTech display controller might use a steady green to indicate successful boot and video signal lock, a blinking yellow to show it’s operating in a reduced performance mode due to overheating, and a blinking red to flag a persistent EEPROM read error. The firmware implementation involves managing a state machine that prioritizes the highest-severity condition for display. Consequently, integrating multi-color LEDs is a low-cost, high-impact design decision that improves debuggability and user experience, making the hardware more communicative and resilient throughout its operational life.
| Debug Method | Information Depth | Hardware Intrusiveness | Best Use Case | Required Skill Level |
|---|---|---|---|---|
| On-Board LED Indicators | Low to Medium. Provides categorical error codes and state information. | Non-intrusive. Designed into the system and requires no physical connection. | Initial power-on debugging, field service triage, and production line functional testing. | Basic. Requires code chart interpretation but no special equipment. |
| UART Serial Console | Medium to High. Can stream detailed textual logs, variable values, and command responses. | Minimally intrusive. Requires a free UART port and a USB-to-serial adapter connection. | Software-driven event logging, monitoring boot sequences, and sending debug commands during development. | Intermediate. Requires terminal emulator knowledge and understanding of log data. |
| JTAG/SWD Debug Probe | Very High. Allows full control: breakpoints, memory/register inspection, and single-stepping code. | Moderately intrusive. Requires dedicated debug header and halts processor execution. | Deep firmware debugging, crash analysis, and initial bring-up of complex microcontroller code. | Advanced. Requires integrated development environment (IDE) and debugger expertise. |
| Logic Analyzer | High for timing/data. Captures digital signal timing and bus transactions (e.g., I2C, SPI). | Somewhat intrusive. Requires physical connection of probes to test points or chip pins. | Diagnosing communication protocol issues, verifying signal integrity, and analyzing hardware timing relationships. | Intermediate to Advanced. Requires setup of triggers and interpretation of waveform diagrams. |
| LED Error Pattern | Likely Interpretation | Immediate Diagnostic Actions | Common Root Causes | Advanced Verification Tool |
|---|---|---|---|---|
| No LED illumination | Complete power failure or MCU not running. | Check input voltage, fuses, polarity. Verify regulator outputs and MCU VCC. | Short circuit, blown fuse, faulty voltage regulator, bad solder joint on power section. | Digital Multimeter (Continuity, Voltage) |
| Solid Red LED | Critical hardware fault or failed self-test. | Consult code chart. Check for overheating components. Measure all power rails for correct voltage. | DRAM initialization failure, flash memory corruption, critical sensor fault. | Oscilloscope (Power Rail Ripple) |
| Blinking Green (1 Hz) | Normal operation in idle or low-power mode. | Typically no action needed. Confirm system responds to expected inputs. | System is functioning as designed, often waiting for a wake-up event or user input. | None required for debug. |
| Alternating Red/Green Blink | Communication bus fault or peripheral initialization error. | Inspect I2C/SPI bus connections. Verify pull-up resistors. Check slave device power. | Disconnected flex cable, missing pull-up resistor, faulty touch controller IC, incorrect slave address. | Logic Analyzer (Bus Capture) |
| Fast Blinking Red | Software crash or watchdog reset loop. | Attempt firmware reflash. Check for stack overflow or memory allocation issues in code. | Firmware corruption, infinite loop, hardware exception causing continuous reset. | JTAG Debugger (Crash Analysis) |
Expert Views
From an embedded systems engineering perspective, on-board debug LEDs are far more than simple power indicators. They are a vital communication channel between the hardware and the developer, especially during the critical bring-up phase when more sophisticated tools may not yet be operational. A well-thought-out LED scheme acts as a real-time state machine visualizer. It allows you to see exactly how far the boot process progresses before a failure, which is invaluable for isolating faults in the initialization sequence of memory, peripherals, or complex drivers like those for TFT displays. In field applications, this simple feature can drastically reduce mean time to repair by enabling technicians to identify common failure modes without needing to ship units back to engineering. The key is in the planning: dedicating GPIOs for debug, documenting the blink codes thoroughly, and ensuring the LED driver code is robust and failsafe. This small investment in design time pays massive dividends throughout the product’s lifecycle.
Why Choose CDTech
Selecting a display solution provider involves evaluating technical support and design-for-manufacturability as much as the component specs. CDTech brings over a decade of specialized experience in TFT LCD and touch panel integration, which translates into practical engineering insights. Their team understands the common pain points in display integration, including power sequencing, interface timing, and mechanical mounting. This expertise is often reflected in their controller board designs, which frequently incorporate thoughtful diagnostic aids like multi-status LEDs to simplify customer integration and debugging. Furthermore, their focus on customization means they can advise on and implement effective debug strategies tailored to your specific application, potentially saving weeks of development time. Choosing a partner like CDTech means accessing not just hardware, but a reservoir of applied knowledge aimed at making your product more reliable and easier to bring to market.
How to Start
Begin by thoroughly documenting the intended behavior of your hardware. Map out the key boot stages and identify potential single points of failure. Next, allocate a minimum of two GPIO pins on your microcontroller for a debug LED, ideally for a bicolor device. Design the circuit with appropriate current-limiting resistors and place the LED in a visible location on your PCB layout. Then, in your firmware’s initialization routine, implement a clear state machine that updates the LED at each major milestone—power on, clock stable, DRAM initialized, peripherals loaded, main loop running. Create a simple, persistent table in your code that maps error conditions to specific blink patterns or colors. Finally, produce a one-page quick-reference guide that decodes these patterns and include it in your hardware manual and silkscreen legend if space allows. This proactive approach embeds diagnosability into your product from the very first prototype.
FAQs
Can I use the same LED for both status indication and debugging?
Yes, this is a common and space-saving practice. However, the firmware must carefully manage priority. A debug error state should typically override a normal status indication to ensure critical faults are never masked. Implementing a priority-based state manager in your code is the recommended approach for shared LED usage.
What if my LED shows a code not in the documentation?
An undocumented code usually points to an unhandled exception or a complex, cascading fault. Start by verifying the power supply integrity under load, as voltage fluctuations can cause unpredictable MCU behavior. Then, attempt to connect with a debug probe to halt the processor and inspect the crash context or exception registers.
Are LED debug codes standardized across manufacturers?
No, there is no universal standard. While some conventions are common, like red for error, the specific blink patterns are unique to each hardware design and firmware implementation. Always consult the technical reference manual or schematic from the original board designer, such as CDTech, for the authoritative decoding guide.
How many unique error codes can I realistically represent with one LED?
With careful design of blink duration and pause intervals, a single-color LED can reliably represent10-15 distinct states before the patterns become too complex to differentiate. Using a bicolor (red/green) LED easily doubles or triples this capacity by adding color as a variable, making it the preferred choice for most applications.
Mastering the use of on-board LED indicators transforms hardware debugging from a guessing game into a structured diagnostic process. These simple components provide an immediate, low-level view of your system’s health, guiding you to the faulty subsystem with remarkable efficiency. Remember to design with diagnostics in mind from the start, leveraging multi-color LEDs for clearer communication. Always document your error codes meticulously and view LED indicators as the first layer in a multi-tiered debugging strategy. By integrating these practices, you can significantly reduce development cycles, improve field serviceability, and build more robust and reliable electronic products. Start by reviewing your current project’s debug capabilities and consider how a planned LED system could save time and frustration in your next bring-up session.
Post Search
Related Articles
-

Capacitive vs Resistive Touch Screen Car Stereo: Which Is Right for You?
-
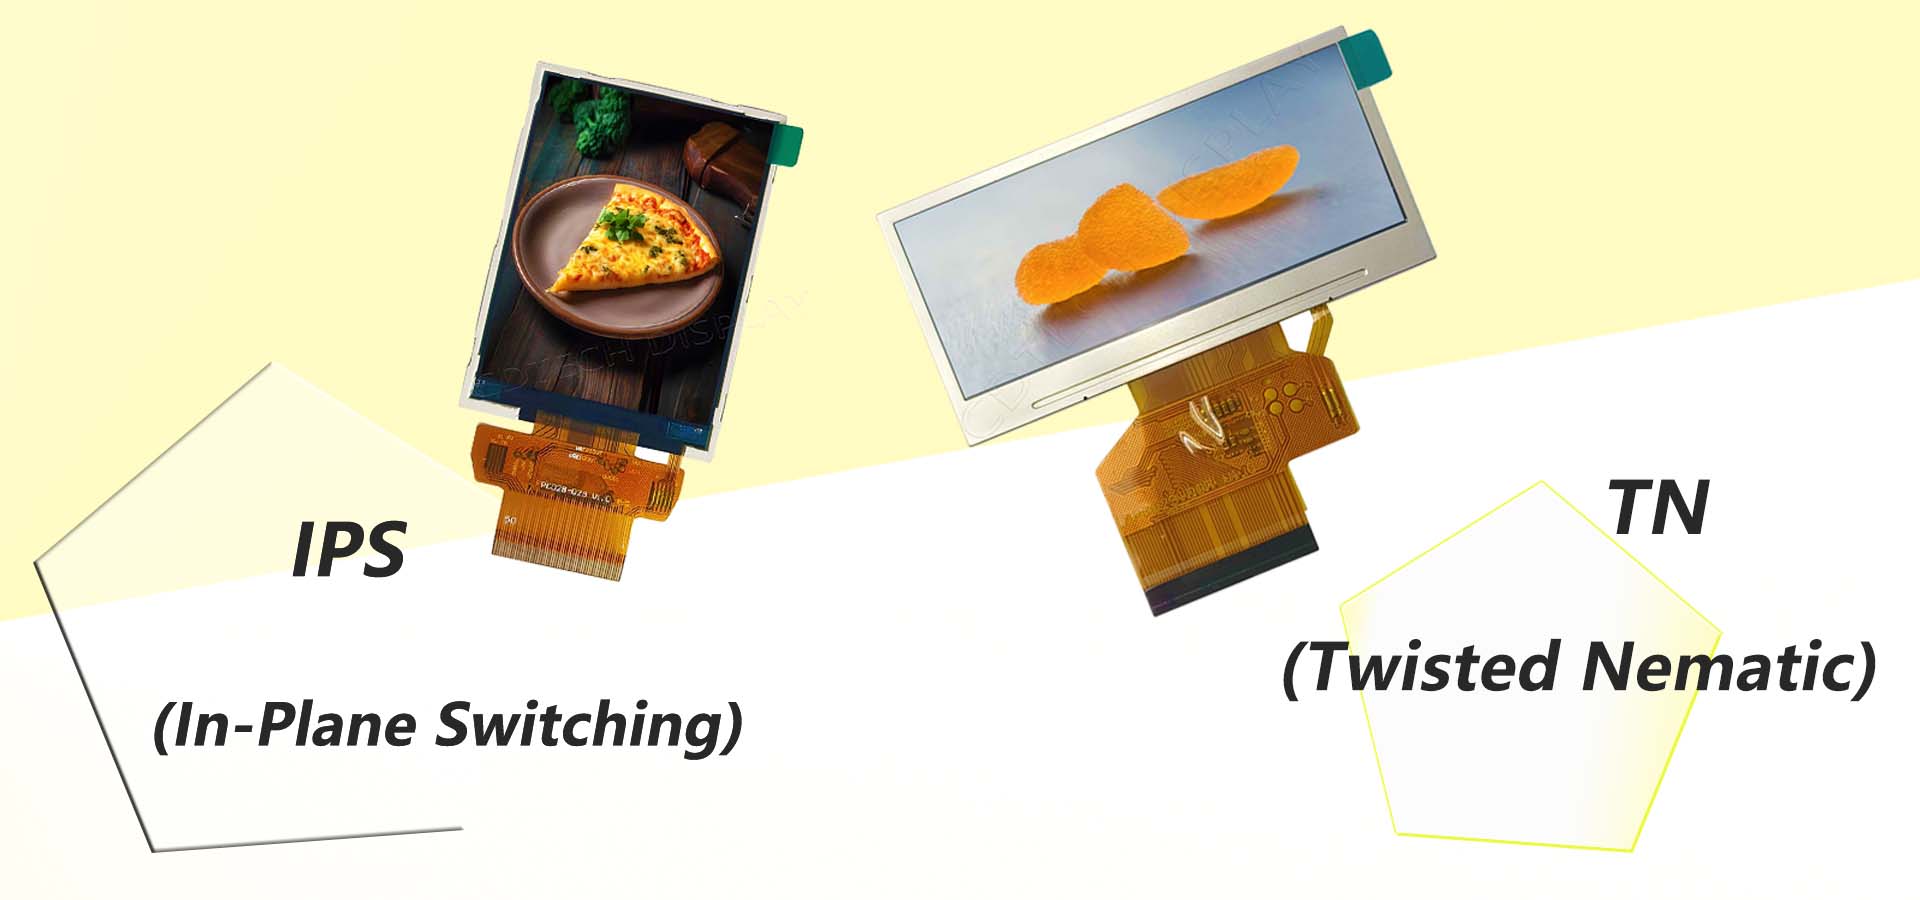
TN LCD vs IPS LCD: How to Choose the Right Display for You
-

Capacitive Touch Panel or Resistive: Which Suits Your Needs?
-

Why Choose an IPS LCD Panel for Your Next Screen Purchase?
-

CDTECH to Showcase Cutting-Edge Display Solutions at SID 2025
-
Comparing Different Types of Displays in Cars: A Detailed Overview
-

White Spots on LCD Screen: Causes, Fixes & Industrial Solutions (2026 Guide)